As an estate and letting agent with a keen eye on local Warrington property trends, it becomes imperative to delve into the nuanced landscape of property types, mainly through the lens of bedroom distribution across various tenures.
This analysis enriches the knowledge base of Warrington homeowners and landlords and positions them advantageously in making informed decisions.
At the heart of this exploration lies the categorisation of properties based on tenure: owner-occupied, owner-occupied with a mortgage, privately rented, and social housing. When dissected by the number of bedrooms – one, two, three, and four or more – each category reveals insightful trends that I can compare with local and national housing narratives.
𝗨𝗻𝗱𝗲𝗿𝘀𝘁𝗮𝗻𝗱𝗶𝗻𝗴𝘁𝗵𝗶𝘀𝗯𝗿𝗲𝗮𝗸𝗱𝗼𝘄𝗻𝗶𝘀𝗰𝗿𝘂𝗰𝗶𝗮𝗹𝗳𝗼𝗿𝗪𝗮𝗿𝗿𝗶𝗻𝗴𝘁𝗼𝗻𝗵𝗼𝗺𝗲𝗼𝘄𝗻𝗲𝗿𝘀𝗮𝘀𝗶𝘁𝘀𝗵𝗲𝗱𝘀𝗹𝗶𝗴𝗵𝘁𝗼𝗻𝘁𝗵𝗲𝗰𝘂𝗿𝗿𝗲𝗻𝘁𝗱𝗲𝗺𝗮𝗻𝗱𝗮𝗻𝗱𝘀𝘂𝗽𝗽𝗹𝘆𝗱𝘆𝗻𝗮𝗺𝗶𝗰𝘀𝘄𝗶𝘁𝗵𝗶𝗻𝗪𝗮𝗿𝗿𝗶𝗻𝗴𝘁𝗼𝗻.
It offers a glimpse into which types of properties are most sought after. For instance, a surge in smaller, one or two-bedroom privately rented properties might indicate a rising demand from young professionals or smaller families, a demographic trend that has been observed nationally. Conversely, a prevalence of larger, owner-occupied homes could reflect a community with a significant number of established families valuing space and comfort.
𝗢𝗻 𝘁𝗵𝗲 𝗼𝘁𝗵𝗲𝗿 𝗵𝗮𝗻𝗱, 𝗪𝗮𝗿𝗿𝗶𝗻𝗴𝘁𝗼𝗻 𝗹𝗮𝗻𝗱𝗹𝗼𝗿𝗱𝘀 𝘀𝘁𝗮𝗻𝗱 𝘁𝗼 𝗴𝗮𝗶𝗻𝗶𝗺𝗺𝗲𝗻𝘀𝗲𝗹𝘆 𝗳𝗿𝗼𝗺 𝘁𝗵𝗶𝘀 𝗴𝗿𝗮𝗻𝘂𝗹𝗮𝗿 𝗮𝗻𝗮𝗹𝘆𝘀𝗶𝘀.
The bedroom distribution across privately rented sectors can guide investment decisions, highlighting portfolio diversification or consolidation opportunities. For instance, a Warrington landlord noticing an undersupply in three-bedroom rental properties might consider acquiring or converting properties to fill this gap, thereby meeting market demand and enhancing rental yields. Our local authority, Warrington Borough Council, will also find it helpful to compare their housing stock against the private rented sector.
Moreover, comparing these local insights with national statistics offers a broader context, allowing Warrington’s property stakeholders to benchmark against broader trends. Such comparisons can reveal whether Warrington is moving in tandem with national shifts – like the growing preference for more space post-pandemic – or if it harbours unique local preferences that could be leveraged for competitive advantage.
Let’s look at the distribution of properties under tenure in the Warrington area, comparing them against the national stats.
In the Warrington area …
- 9.29% of Warrington homes are 1 bed households, compared to 11.4% nationally.
- 23.46% of Warrington homes are 2 bed households, compared to 27.1% nationally.
- 45.31% of Warrington homes are 3 bed households, compared to 40.4% nationally.
- 21.94% of Warrington homes are 4+ bed households, compared to 21.1% nationally.
Next, let me look at the distribution over the tenures in Warrington …
- 35.27% of Warrington homes are owned outright, compared to 32.8% nationally.
- 34.16% of Warrington homes are owned with a mortgage, compared to 28.7% nationally.
- 15.29% of Warrington homes are social rented (Council & Housing Association), compared to 17.1% nationally.
- 15.27% of Warrington homes are privately rented, compared to 20.3% nationally.
And now let’s look at household tenure by bedrooms.
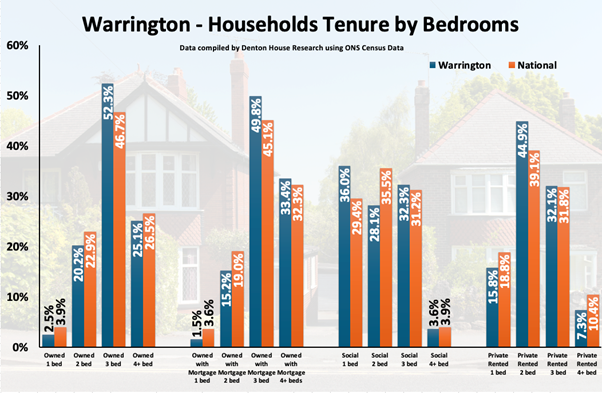
Owned Outright
- 2.46% of Owned households in Warrington have 1 bedroom (compared to the national average of 3.9%)
- 20.16% of Owned households in Warrington have 2 bedrooms (compared to the national average of 22.9%)
- 52.32% of Owned households in Warrington have 3 bedrooms (compared to the national average of 46.7%)
- 25.06% of Owned households in Warrington have 4 or more bedrooms (compared to the national average of 26.5%)
Owned with a Mortgage
- 1.51% of Owned (with a mortgage) households in Warrington have 1 bedroom (compared to the national average of 3.6%)
- 15.21% of Owned (with a mortgage) households in Warrington have 2 bedrooms (compared to the national average of 19.0%)
- 49.84% of Owned (with a mortgage) households in Warrington have 3 bedrooms (compared to the national average of 45.1%)
- 33.45% of Owned (with a mortgage) households in Warrington have 4 or more bedrooms (compared to the national average of 32.3%)
Social Renting
- 35.99% of Social Rented households in Warrington have 1 bedroom (compared to the national average of 29.4%)
- 28.13% of Social Rented households in Warrington have 2 bedrooms (compared to the national average of 35.5%)
- 32.26% of Social Rented households in Warrington have 3 bedrooms (compared to the national average of 31.2%)
- 3.63% of Social Rented households in Warrington have 4 or more bedrooms (compared to the national average of 3.9%)
Private Renting
- 15.77% of Private Rented households in Warrington have 1 bedroom (compared to the national average of 18.8%)
- 44.88% of Private Rented households in Warrington have 2 bedrooms (compared to the national average of 39.1%)
- 32.05% of Private Rented households in Warrington have 3 bedrooms (compared to the national average of 31.8%)
- 7.30% of Private Rented households in Warrington have 4 or more bedrooms (compared to the national average of 10.4%)
So, what does it all mean? The Warrington housing market, with its diverse range of properties and tenures, offers a rich tapestry for analysis.
For Warrington homeowners and landlords alike, understanding how the number of bedrooms correlates with different types of tenure provides a strategic lens through which to view their home or investments. It underscores the importance of local market intelligence in making informed decisions for buying, selling, or renting properties.
As Warrington continues to evolve, staying abreast of these trends will empower current property holders and attract prospective buyers and investors to this vibrant town.
And finally, to answer the question posed at the start, 45.31% of Warrington households are 3-bed homes – is that enough? Well, that can’t be answered in this short article, as there is such a difference between the tenures. Instead, the article’s purpose was to highlight the information and make you think.
Why? Ultimately, the most knowledgeable agents, homeowners and landlords will recognise the value of detailed, localised property insights, using them to navigate the complexities of the Warrington property market with confidence and understanding.
Do let me know your thoughts.