Traditionally, the first four months of the year are usually an estate agents’ busiest time for house sales. However, if the last three years have taught us anything, nothing is ‘normal’ and ‘usual’ anymore.
The Southampton property market is finding that with the friction of higher mortgage rates and the effects of inflation on household budgets; things are slightly different in 2023 compared to recent years.
So, when asked, ‘What’s happening now in the Southampton property market?’ there is a more complex answer.
The property market is fundamentally a balance of supply and demand.
In 2021/22, demand (people wanting and able to buy) was bigger than the supply of properties available to buy. Hence Southampton house prices rose. Let us see what is happening now in Southampton in 2023.
Looking at February’s sales numbers alone …
391 properties sold subject to contract (stc)in the Southampton area in February.(Compared to 465 properties sold (stc) in February 2022 and 484 sold (stc) in February 2021).
(Southampton being SO14-SO19).
Meanwhile, the number of properties coming onto the market (listed) in Southampton has also changed.
459 properties came onto the marketin the Southampton area in February.(Compared to 467 properties listed in February 2022 and 470 properties in February 2021).
Therefore, in February 2023, 1.17 homes came onto the market (listed) in Southampton for every home sold (stc), compared to 1.00 homes per property sold (stc) in February 2022.
Interesting when compared with the national statistics. In February 2023, 1.48 homes came onto the market in the UK for every home sold (stc), compared to 1.11 homes per property sold in February 2022.
What does this all mean for house prices and for Southamptonpeople thinking of selling?
Well, we need to go back to last year first.
Roll the clock back to autumn 2022. Interest rates had been on the rise throughout the summer. These increased interest rates were starting to have a subtle dampening effect on the UK property market.
In the first six months of 2022, an average of 27,590 UK properties were sold per week. Two months before the Autumn Budget, that had eased to an average of 24,229 UK properties selling per week. Three months after the Autumn 2022 Budget, it slumped to an average of 16,821 UK sales per week.
The weekly average for February 2023 was 22,192 UK sales per week,the best since September 2022.
The effects of Liz Truss’s Budget in September 2022 have waned. That budget triggered turmoil in the mortgage market as lenders withdrew funding and mortgage rates spiked. The availability (and pricing) of mortgages has improved lately, and mortgage rates have stabilised, albeit at higher rates, piling pressure on household budgets.
The housing market is driven in part by sentiment and confidence. Both took a beating in the autumn of last year, yet things appear to be easing in that department. In a nutshell, people are still determining how the Southampton property market will go in 2023.
As you can see from the sales and homes coming on the market (listings) statistics at the start of this article, the demand for Southampton homes is still at a decent level (very similar to pre-Covid levels seen in 2016 to 2019), whilst listings have decreased very slightly (but there is still a good choice of Southampton homes to buy).
So, this then comes to the issue of Southampton house prices.
Southampton house prices are falling.
There, I have said it. Of course, Southampton house prices are falling. The house prices paid in the ‘silly season’ in late 2021/early 2022 are not paid today in March 2023. In 2021, it was a ‘bun fight’; the Southampton property market was ‘on fire’, and people were outbidding each other to secure property. Now those times are over, so the prices being paid are much more reasonable.
Is that a house price crash?No, it’s just a house price adjustment!
Southampton house prices will continue to drift slowly and steadily downwards throughout 2023 as the effects of interest rates and affordability clip the wings of many buyers. This is good news because if Southampton homebuyers (and sellers) don’t believe there will be large house price falls happening, it will make more people come onto the Southampton property market in the spring and summer to buy and sell property.
As I have said in recent articles on the Southampton property market, the lower priced/smaller sized properties sell more than the middle priced/middle sized properties. This is because the smaller properties are more attractive as higher mortgage rates put a dampener on home buyers’ household budgets.
Also, the cost-of-living crush is making more mature homeowners downsize their mid-sized homes that are costly to heat. Interestingly, in a few locations around the UK, the upper quintile (top 20%) in terms of house prices are immune to all this downturn in demand. Very strange!
Yet back to the question of Southampton house prices.
The house price data that many journalists use to judge house prices are between six and nine months old. If a property has a sale agreed upon in, say, March, it will complete (completion is when the legal work is done, monies transferred, and keys handed over) in August or September and show on the Land Registry figures by November or December at the earliest (i.e. eight or nine months later).
Yet now, through Denton House Research, we have access to data on house prices that are a matter of a week old.
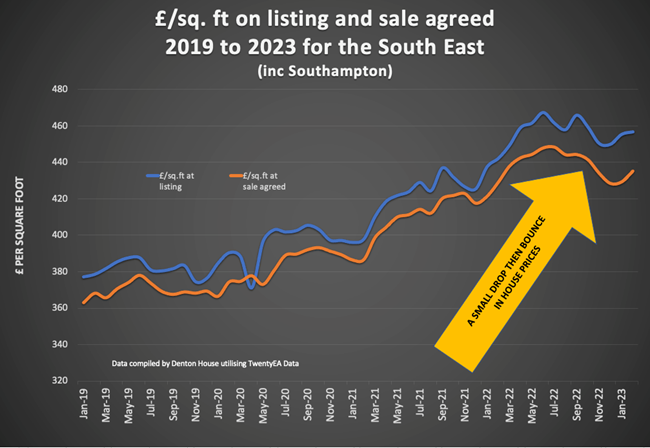
The listings are £/sq. ft shows what homeowners are putting their homes on the market at and the sales £/sq. ft what homes are selling for. By tracking data on the average price per square foot for both listings and sales agreed, we can track exactly what is happening to house prices in real-time. The data is currently at the regional level (more local data to follow soon), yet it shows what is happening today to house prices.
- In June 2020, the average £/sq. ft for every listing in the South East region was £402.80 per square foot, and the average £/sq. ft for every sale regionally was £380.62 per square foot (the £/sq. ft on sales tends to be lower than the listings because smaller/cheaper homes have a higher propensity to sell than more expensive/larger homes).
- In August 2022, the average £/sq. ft for every listing in the South East region had risen to £457.78 per square foot, and the average £/sq. ft for every sale regionally was £444.13 per square foot.
- In February 2023, the average £/sq. ft for every listing in the South East region had drifted downwards very slightly to £456.57 per square foot, and the average £/sq. ft for every sale regionally was £435.16 per square foot.
So, what does this all mean?
House prices have dropped a few percentage points since the summer (not the 10% to 20% the doom mongers have quoted).
Also, the lowest point regarding house prices in all regions of the UK was January 2023, and the figures you see in these stats have a slight upturn in them in February 2023.
In the coming weeks, I will delve deeper into the statistics. We have to be aware of the gap between listing £/sq. ft and sale £/sq. ft. If this gap gets too big, sellers are getting too optimistic about pricing.
They will suffer as their home languishes on the market, become stale, and experience shows they will have to reduce their property to an asking price under what they would have achieved if they had priced it realistically from day one.
Will house prices continue to drop in Southampton?
Yes, the February 2023 uplift in house prices will be a blip. Unless something seismic happens, Southampton house prices will still be around 10% (+/- a few percentage points) lower at the end of 2023 than in the late summer of 2022.
This is a correction from the inflated prices paid in late 2021/mid 2022.
What about those people that have bought in the last 12 months?
The peak of the Southampton property market was the late summer of 2022, yet no one who bought their Southampton home in the late summer is currently considering selling. So, they won’t be affected in any way by this short-term house price correction (remembering the middle to long-term data shows house prices always bounce back).
If the Southampton property market takes a corrective dip, then Southampton buyers should consider not necessarily going in at the asking price.
Yet, that can only be said for some houses because it depends on your market. If there’s huge demand and there are six viewers or six people wanting to offer the type of home you want, house prices will hold up.
But if you are the only person who has viewed it in the last three months, that’s a different story. It would be best to ask questions like how long the property has been on the market and how many offers there have been.
What about Southampton homeowners who don’t need to sell?
For those Southampton homeowners who aren’t selling, remember if your Southampton home drops in value by 10%, it’s still worth 90% of what you thought it was worth. You only lose money if you sell.
Also, are you losing money? It’s money you never had, and the one you want to buy has come down in price even more than yours. Remember, 8 in 10 people move up the market when they move, so a 10% drop is a larger drop on the more expensive home than yours, meaning it’s cheaper to move.
The statistics and sentiment now show there is a lot of hope out there, and there is still quite a lot of appetite for people to buy. I would never say never, but the chances of a house price crash are minimal.