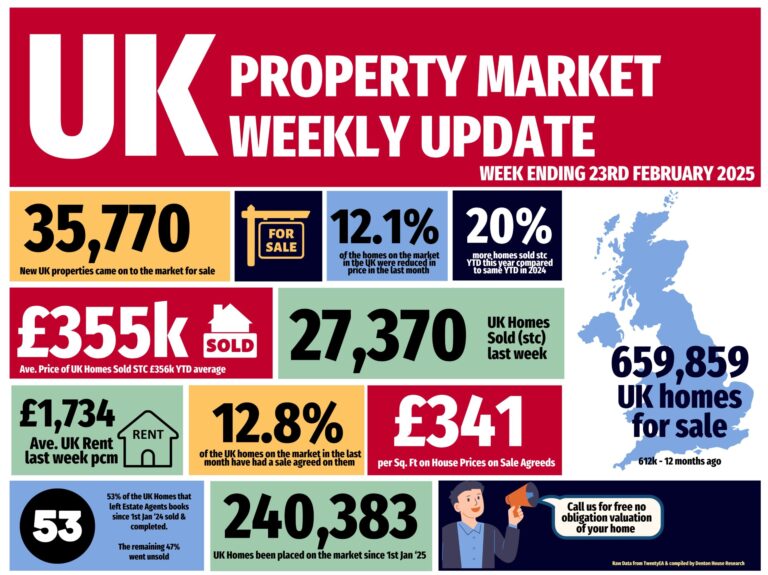
· Listings (New properties coming on to the market) – 21.2 UK listings this week (week 49), an expected drop of 2.6k from last week. 8.5% higher 2024 YTD than 2023 YTD.
· % of Resi Sales Stock being reduced (Monthly): 11.1% of Resi sales stock was reduced in the last month (November). 13% in October & 14% in September. Not brilliant as Stock levels are dropping in the usual run up to Christmas.
· Total Gross Sales – 20.7k UK homes sold stc this week (Week 49), 9.6% lower than last week (as expected). 24% higher than the same standalone week (week 49) in 2023. Also, 8.9% higher than 2017/18/19 YTD levels & 15.3% higher than 2023 YTD levels.
· Sale Thru rate (Monthly): UK Estate Agents sold 14.9% of their Resi sales stock last month. 2024 average is 15.7% & the 7 year long term average is 17.9% per month – yet don’t forget that was only in mid/late 20%’s in the crazy years of 20/21/22).
· Sale fall-throughs – For the week 49, Sale Fall Thrus (as a % of Gross sales Agreed) 26.3%. The 7 year Long Term weekly Average is 24.3% and it was 40%+ in the two months following the Truss Budget in the Autumn of 2022.
· Net Sales – 15.2k this week (average for last 4 weeks 17.1k). 21% higher than the same week 49 in 2023, 52% higher than the same week 49 in 2022 & still 17.5% higher YTD in 2024 compared to YTD 2023.
· % of Homes exchanging vs homes unsold – Of the 1,474,594 UK homes that left UK Estate Agents books since the 1st Jan 2024, 792,138 of them (53.7%) exchanged & completed contracts (meaning the homeowner moved and the estate agent got paid). The remaining 682,456 (46.3%) were withdrawn off the market, unsold. In essence you a flip of the coin chance of actually selling, homeowners moving and the estate agent getting paid.
· UK House Prices – As explained in the show, the £/sqft figure foretells and predicts the Land Registry 5 / 6 months in advance with an accuracy rating of 92%. The Initial November figure, in this important metric, is £344/sq.ft. In January ’24, it was £330/sqft, a rise of 4% in the last 10 months (and for comparison) in August ’24, it was £334/sq.ft
· Resi Sales Stock on the Market (Monthly Stat) : 677k at end of November. For comparison, Nov ’23 – 664k, Nov ’22 – 527k, Nov ’21 – 397k, Nov ’20 – 617k, Nov ’19 – 608k
· Resi Sales Sold STC Pipeline (Units) (Monthly Stat): 487k at end of November. For comparison, Nov ’23 – 391k, Nov ’22 – 436k, Nov ’21 – 509k, Nov ’20 – 533k, Nov ’19 – 353k
If you would like to chat to us about our local property market, feel free to call us on 01604 626 626 or drop us a line at [email protected]