
✅ Listings (New Properties on the Market)
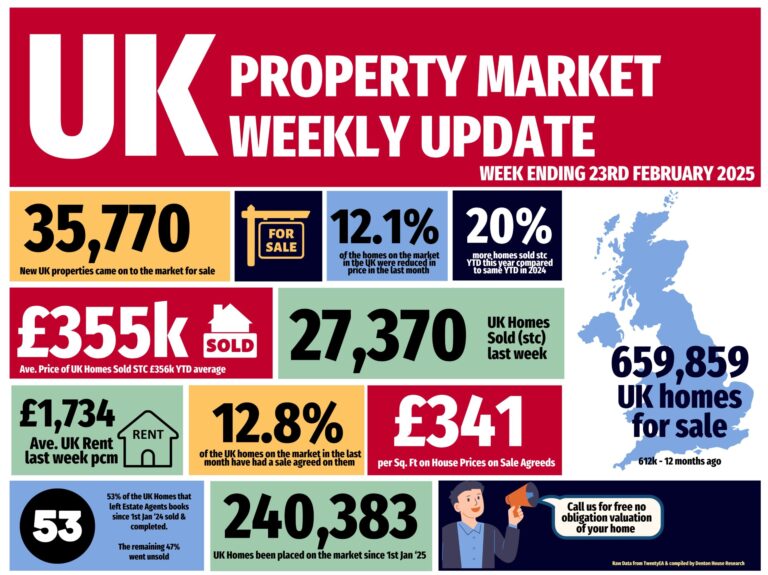
35.9k new listings this week (last week 34.9k)
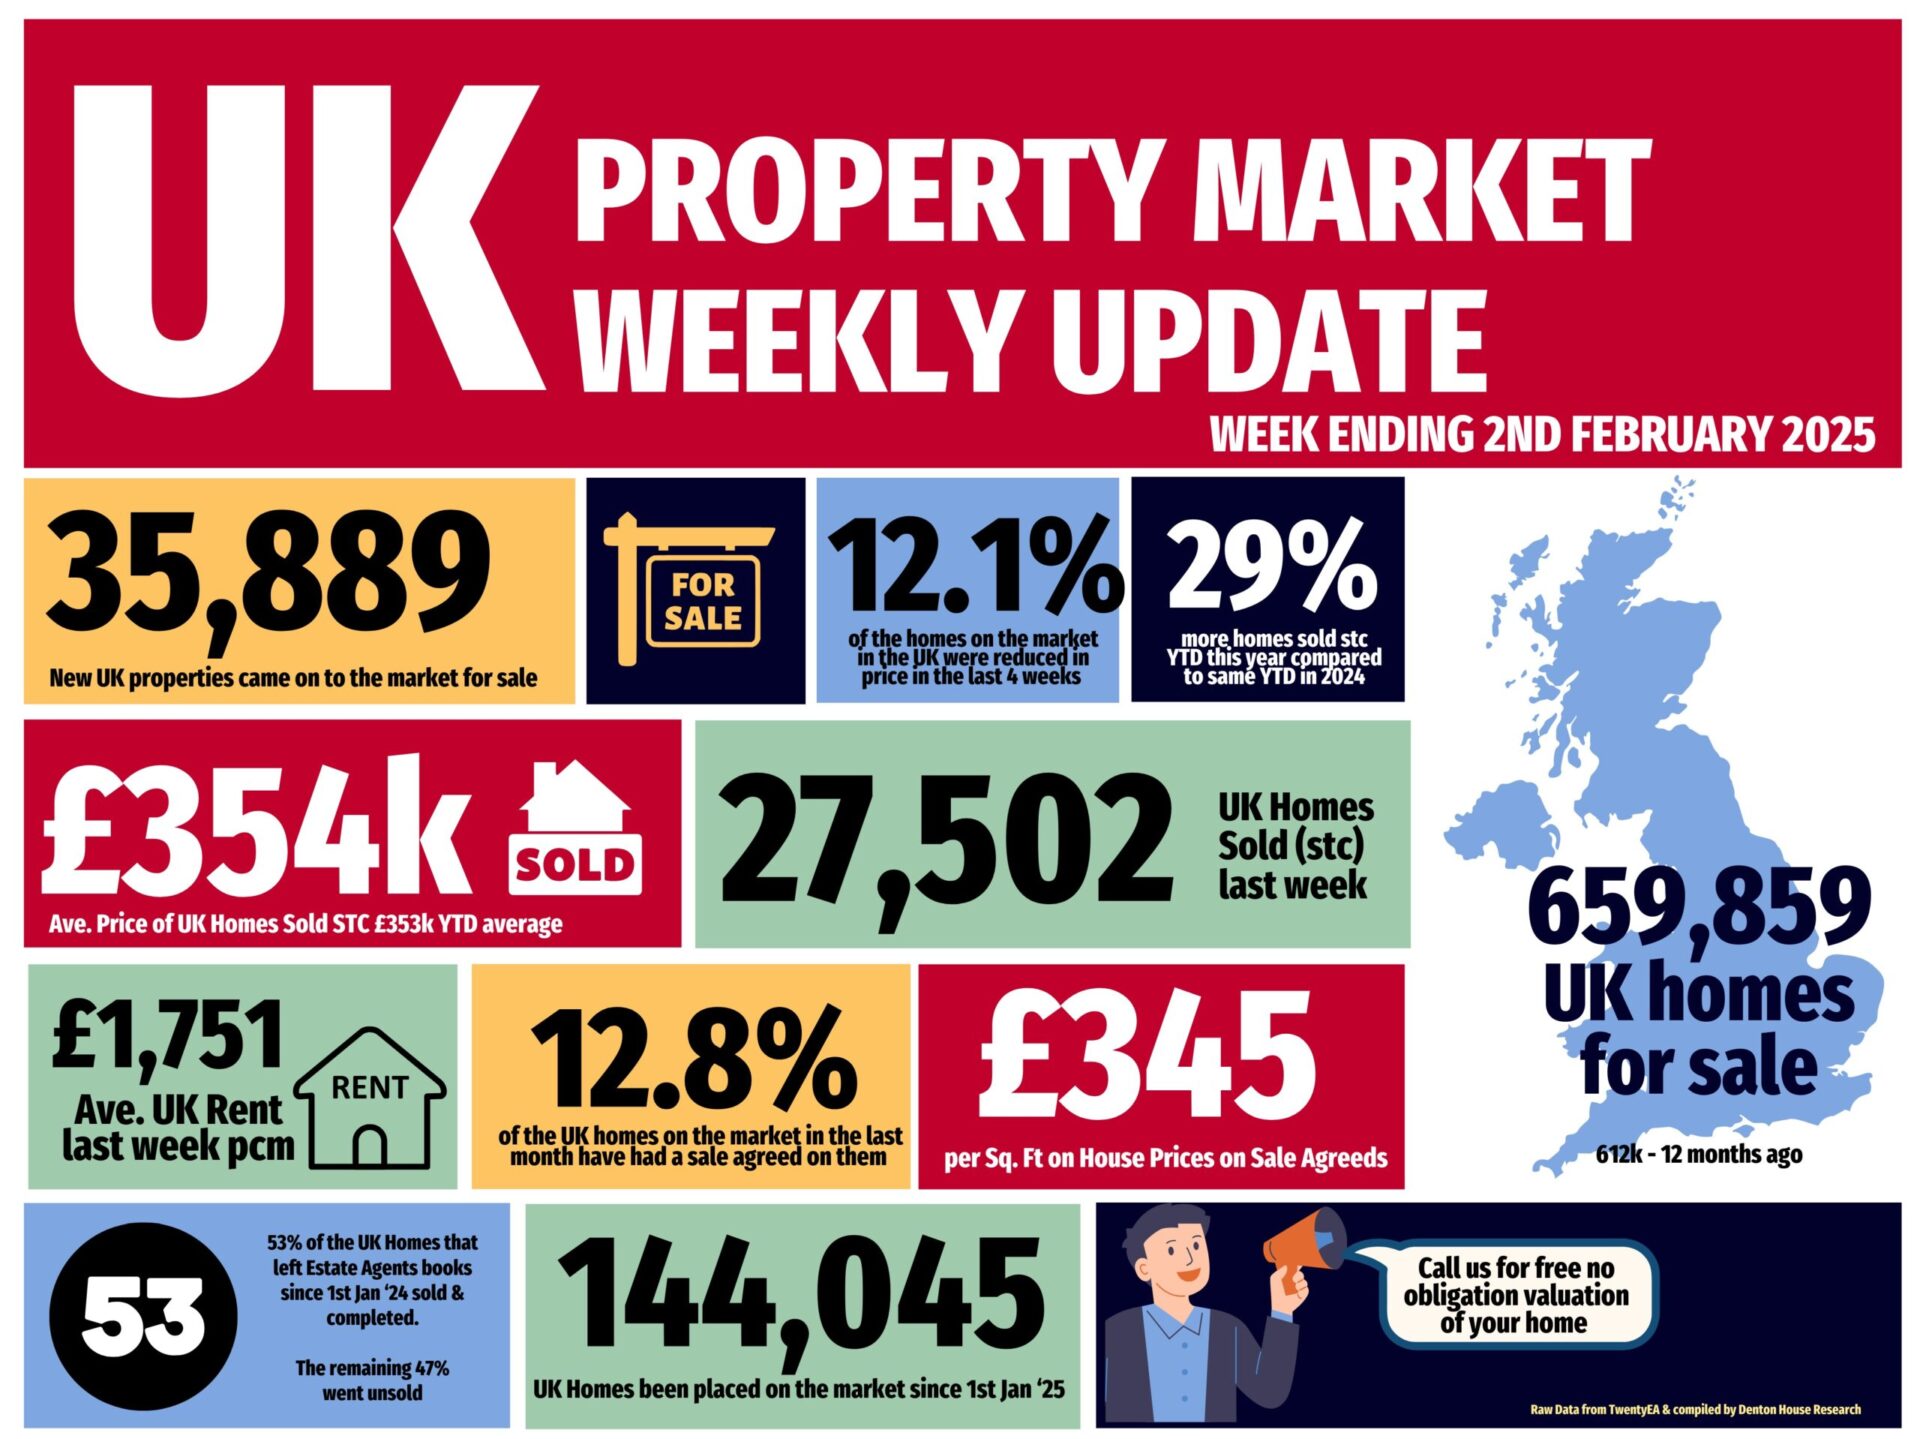
That’s 13% higher than Week 4 of 2024 YTD and 12% higher YTD compared to 2017/18/19.
✅ Price Reductions (% of Resi Stock)
21k Price Reductions this week – meaning an approx run rate of 1 in 8 of Resi Sales stock per month is being reduced (12.1%).
For comparison, 11.9% average in 2024, though the long-term 5-year average is 10.6%.
✅ Total Gross Sales (Agreed Sales)
27.5k UK homes sold STC this week, up from 25.7k last week in Week 3
That’s 29% higher YTD compared to 2024 and 37% higher than 2017/18/19 YTD levels.
✅ Sale-Through Rate (Monthly in Arrears)
January’s Run rate of 15% of Resi stock sold stc. For comparison, 13.9% of residential sales stock sold in January 2025. 2024 monthly average: 15.3%. Long-term 8-year average: 17.9%.
✅ Sale Fall-Throughs
6,186 Sale fall-thrus last week from Resi Sale Sales Pipeline of 440,431 homes sale agreed (sold stc).
Another method is that week’s sale fall thrus as a % of gross sales that week. This week, that is 22.5% (last week 23.3%). Slightly below the 7-year average of 24.2%, but well below the 40%+ levels post-Truss Budget (Autumn 2022).
For January ’25 as a whole, 6.03% of sales in the UK estate agents sales pipelines fell thru in Jan 25. For comparison, 2024 average: 5.36%.
✅ Net Sales (Gross sales for the week less Sale Fall Thrus for the week)
21.3k net sales this week, compared to a typical week 3 average of 19.41k. Last week
Week 3 2025) – 19.7k.
2025 YTD is 29% higher than compared to 2024 YTD and 32% higher than YTD 2017/18/19.
✅ Residential Sales Stock on the Market
660k properties on the market at the end of January 2025 (up, as expected, from 605k in December).
Historical comparison for end of January :
• 2024: 612k
• 2023: 525k
• 2022: 373k
• 2021: 538k
• 2020: 591k
• 2019: 614k
• 2018: 540k
• 2017: 525k
✅ Residential Sales Sold STC Pipeline
440k sales agreed but not yet completed at the end of January 2025.
Historical comparison for January :
• 2024: 354k
• 2023: 347k
• 2022: 447k
• 2021: 459k
• 2020: 308k
• 2019: 290k
• 2018: 282k
• 2017: 270k
✅ UK House Prices (£/sq.ft)
As always, the £/sq.ft metric predicts Land Registry figures 5 months in advance with 92% accuracy (the orange line of the graph).
January’s final figure: £342/sq.ft.
• December ’24 : £339/sq.ft
• August ’24: £334/sq.ft
• January ’24: £330/sq.ft
This means UK house prices have risen 3.64% in the last 12 months.
If you would like to chat to us about our local property market, feel free to call us on 01604 626 626 or drop us a line at [email protected]