For anyone trying to buy a home in Southampton today, that headline probably sounds ridiculous.
Southampton house prices are higher, deposits involve larger sums of money, mortgage payments can feel substantial and household finances are being squeezed by the wider cost of living. It is therefore understandable that many Southampton people look back at the last few decades and conclude that buying a home must have been considerably easier then.
Yet when inflation is considered, Southampton house prices tell a rather different story. Back in 2007, the average Southampton home cost £160,036. Today in 2026, the equivalent average price is £234,687. That is an increase of £74,651, or 46.6%, so in straightforward pounds and pence Southampton property has clearly become more expensive.
The problem is that £160,036 in 2007 is not the same amount of money as £160,036 today.
Inflation has increased by 74.5% over that period. Food, cars, energy, building materials, services and almost everything else we buy cost considerably more than they did nearly two decades ago. Therefore, if we want to make a proper comparison between Southampton house prices in 2007 and 2026, we have to translate that old £160,036 figure into today’s money.
When we do that, it becomes £279,263.
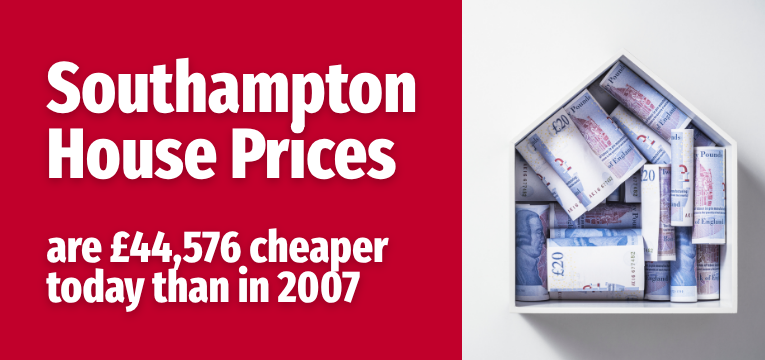
Compare that with today’s actual average Southampton house price of £234,687 and the picture changes considerably. In inflation adjusted terms, the average Southampton home today is £44,576 cheaper than it was in 2007, equivalent to a fall of approximately 16% in real terms.
That may sound contradictory, but it is simply the difference between what economists call nominal and real prices.
The nominal price is the number on the price tag. If a home increases from £200,000 to £300,000, its nominal value has risen by £100,000. A real price asks a different question: once inflation is taken into account, what is that money actually worth?
An easy way to understand this is to think about what £1 buys. Back in 2007, £1 would buy six Cadbury Freddo bars (love those!). Today, the same £1 would buy only around two and a half bars. It is still a pound coin, and the £1 stamped on it has not changed, but its purchasing power has changed. That is essentially what inflation does, and it is why comparing a 2007 house price directly with a 2026 house price can be so misleading.
That distinction matters.
None of this means buying a Southampton home today in 2026 is easy. Raising a deposit can still be difficult, mortgage affordability remains an issue for many Southampton households and monthly repayments can take a substantial chunk of income. Yet saying Southampton property is simply “more expensive than it used to be” does not tell the whole story either. Then there is another argument people understandably raise at this point: what about wages?
Using the ONS figures of £21,944 for average UK annual wages in 2007 and £40,301 today, wages have increased by 83.6%. Over the same period, inflation has risen by the already mentioned 74.5%. On those figures, average real wages have risen proportionally by 5.2% in real terms (i.e. British people are 5.2% better off in 2026 than 2007).
Meanwhile, Southampton house prices have increased by just 46.6% in headline price/cash terms, substantially less than either inflation or the increase in average wages over the same period. That does not remove the very real financial pressures facing today’s buyers. Interest rates, deposits, mortgage lending rules and household costs all affect affordability, and those factors can make buying a home feel incredibly difficult.
But it does put the house price itself into perspective.
Saying an average Southampton home in 2007 was £160,036 sounds cheap when viewed through 2026 eyes.
Once you recognise that £160,036 then had the spending power of roughly £279,263 today, the comparison becomes very different. So yes, Southampton house prices have risen substantially in pounds and pence over the last two decades. Yet after allowing for inflation, the average Southampton home is actually around £44,576 cheaper today in real terms (spending power) than it was in 2007.
Sometimes the number on the price tag goes up, while the real price goes down.