The housing market has had a tumultuous and unpredictable year – seeing lockdowns lift, stamp duty holidays come into place and stock shortages up and down the country. Despite these changes, the housing market in general has remained hot with Peterborough selling a total vale of £730,000,000 worth of property. 64.9% of Peterborough’s population own their own homes while 17.4% live in privately rented accommodation.
Sales Market
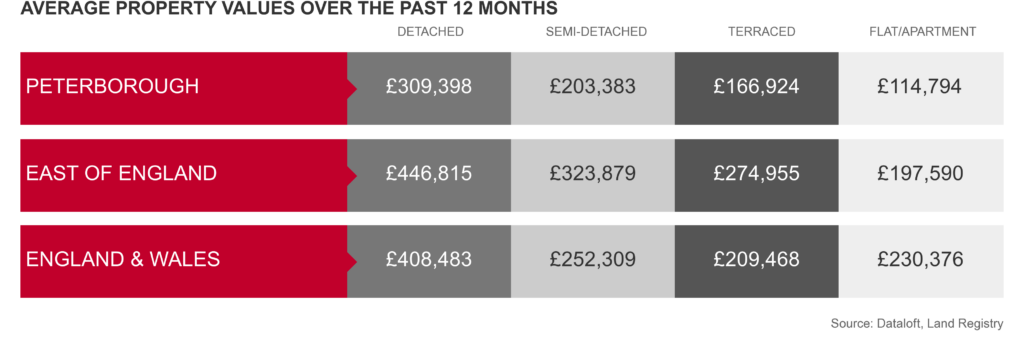
Over the last 12 months, the average sales price in Peterborough was £217,985 with the highest value recorded by the Land Registry was £275,000 for a flat and £1,650,000 for a house. 6% of these sales were flats/apartments achieving an average sales price of £114,794 whilst houses achieved an average price of £227,607. In the last 5 years there have been 3510 new private homes built across the Local/Unitary Authority of Peterborough, an average of 702 per year and in 2021 the average price of a new build was £246,983. See the chart below for a break down of average prices by property type in comparison with the region and market as a whole:
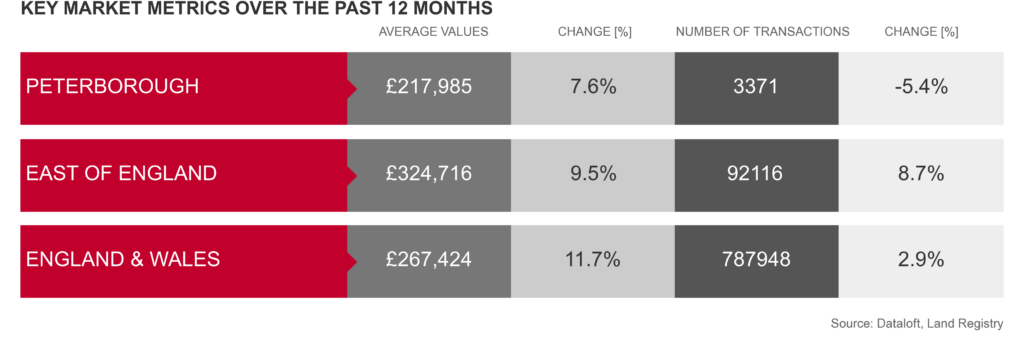
A total of 3,371 transactions total took place this year, almost 6% lower than last year but with a 7.6% average higher sales price. Church Street, PE6 saw the most action with the most number of transactions recorded.
The Peterborough branch have seen the growing demand in owner occupiers looking to upsize to allow more space for working from home, particularly in the 3 and 4 bed type properties. The limited supply of properties being listed during the lockdown led to new properties that were listed being in high demand, resulting in bidding wars, which then saw a surge in property prices.
They also saw a desire for properties on the outskirts of Peterborough which we believe the pandemic plays a role in, with people preferring a less busy environment and with home working the commute is less of a key factor when searching. Mortgage rates are also at an all time low with very competitive rates being offered which has also helped boost the prices.
Looking at the transactions that took place this year, March had considerably more action following a relatively good end to last year (2020). However, the market seemingly took a steep drop in July onwards just as the Stamp Duty Holiday was due to come to an end on September 30th.
Lenders have really tightened criteria on Cladded buildings which covers quite a large percentage of apartment blocks. While they are not a legal requirement for sellers, mortgage lenders sometimes request an EWS1 fire safety inspection form before they issue a mortgage offer.
If we break down these transactions by property type, we can see that Detached properties were the most popular in Peterborough, closely followed by Semi-detached and terraced – similar to the rest of the region.
Lettings Market
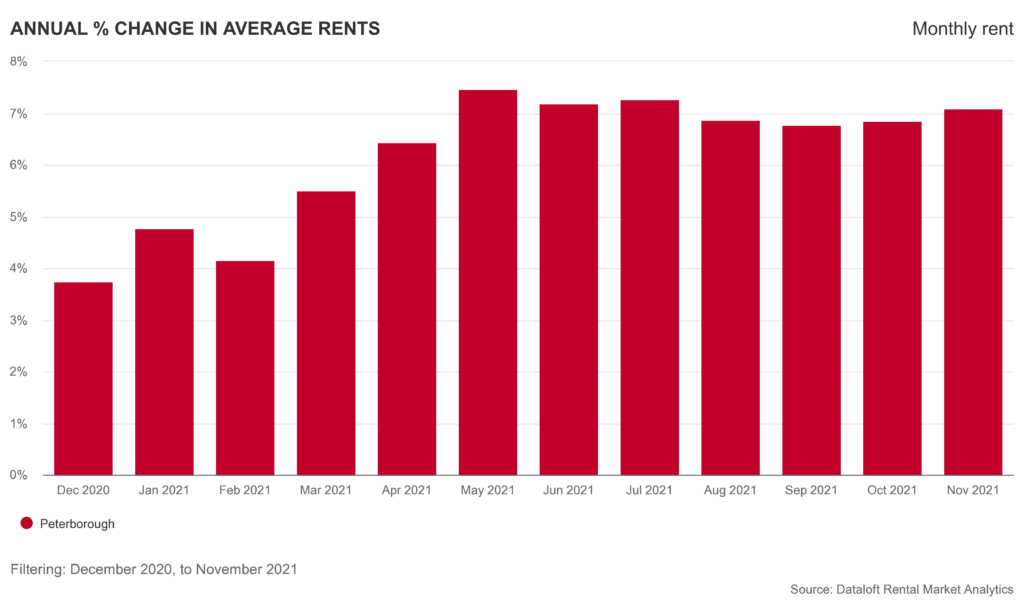
Over the last 12 months, the average rent achieved for properties let in Peterborough was £775 per month. This is a +7% change on the previous 12 month period.
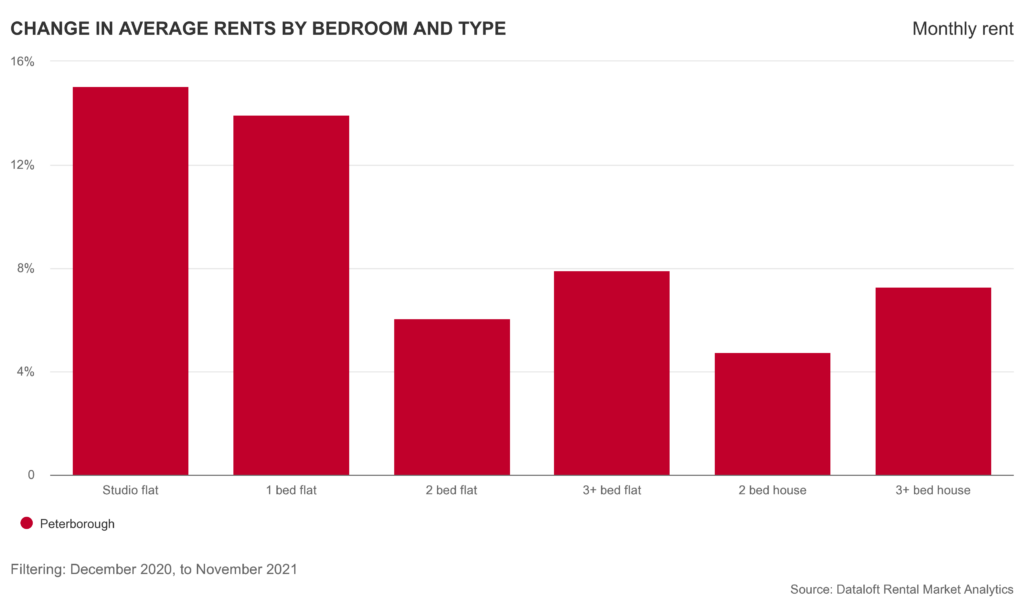
From the chart below, we can see the average rent by room and by property type. If you were looking to invest in the Peterborough market based on this chart, you would potentially be looking for a Studio or 1 bedroom flat/apartment to try achieve the best yield.
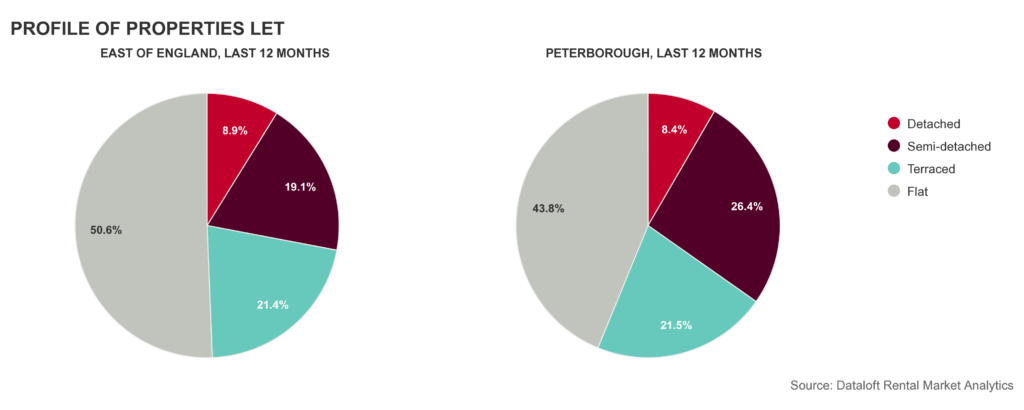
44% of properties let in the past 12 months were flats, achieving an average rental value of £706 per month. Houses achieved an average rent of £849 per month. 46% of tenants were between the ages of 18 and 29 with 33 being the average.
For more information and advice about purchasing or renting out a property in 2022, give our expert team a call on 01733 321500.
*Information taken from and sourced by DataloftInform